
Blog / Cross-Validation Techniques for GCC Marketing Analytics
Cross-Validation Techniques for GCC Marketing Analytics
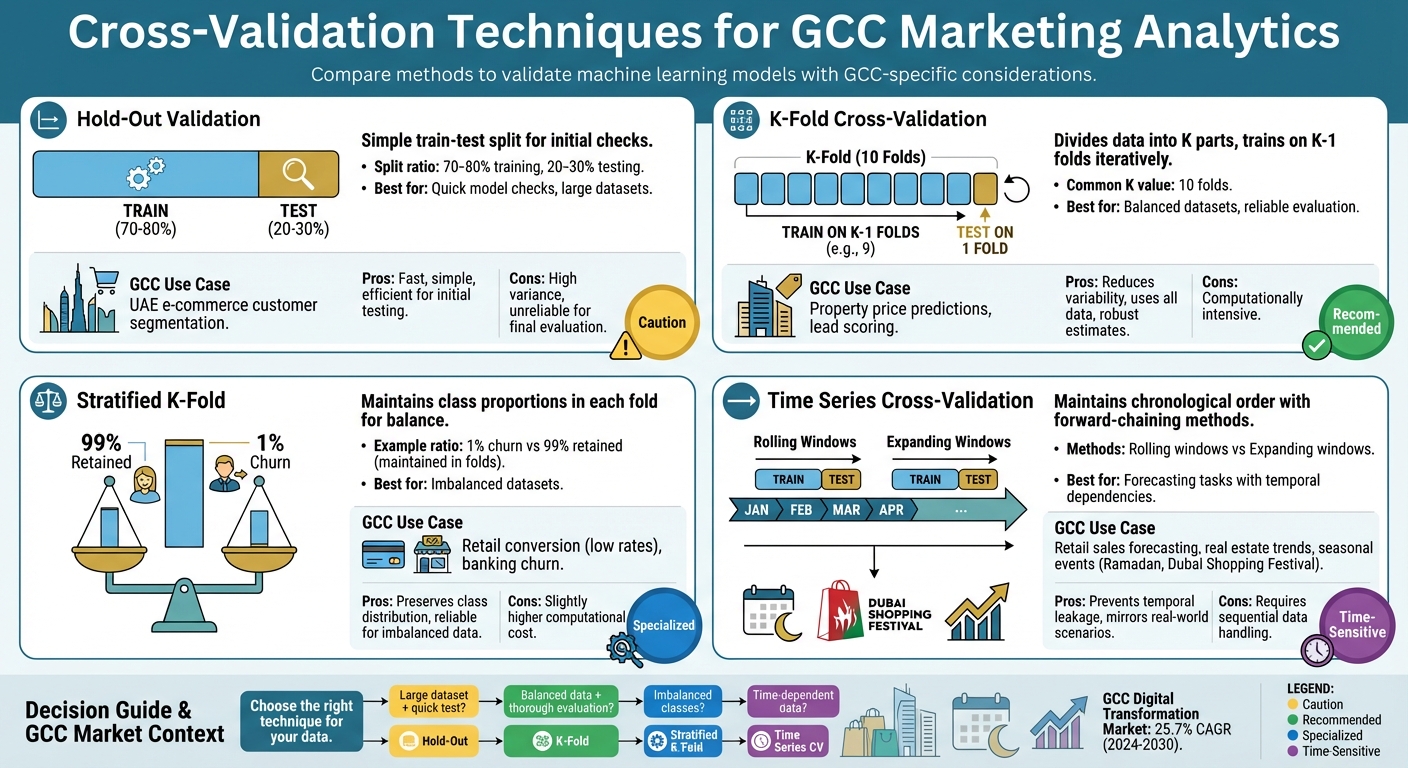
Cross-validation helps test how well predictive models perform on unseen data, ensuring reliability in GCC markets like retail and real estate. This is critical given challenges like data imbalance (e.g., only a small fraction of property browsers make purchases) and seasonal demand shifts (e.g., Ramadan or Dubai Shopping Festival). Key techniques include:
- Hold-Out Validation: A simple train-test split (e.g., 80% training, 20% testing) for quick model checks. Useful for UAE e-commerce but less reliable for final evaluations due to high variance.
- K-Fold Cross-Validation: Divides data into K parts, trains on K–1 folds, and tests on the remaining fold. Reduces variability and works well for GCC property price predictions or lead scoring.
- Stratified K-Fold: Maintains class proportions in each fold, addressing imbalanced data issues common in retail or banking (e.g., low churn rates).
- Time Series Cross-Validation: Keeps the chronological order of data for forecasting tasks, such as retail sales or real estate trends, avoiding temporal leakage.
Each method addresses specific challenges in GCC analytics, ensuring models remain reliable across shifting market conditions.
Cross-Validation Techniques for GCC Marketing Analytics Comparison
Which Cross Validation Method to Use in Machine Learning?
Hold-Out Validation for Initial Model Testing
Hold-out validation, often referred to as the train-test split, involves dividing a dataset into two parts: typically 70–80% for training and 20–30% for testing. This approach allows the model to learn patterns from one portion of the data and then be evaluated on unseen data to gauge its performance. For GCC retail analytics, this method provides a simple and effective way to start evaluating models.
In the context of UAE e-commerce customer segmentation or sales forecasting for Dubai-based retailers, hold-out validation is both practical and efficient. It’s a quick way to check if a churn prediction model or ROI forecasting algorithm shows potential before investing in more intricate validation methods. For forecasting tasks, using a sequential split - training on historical data and testing on the most recent period - helps avoid issues like temporal leakage. While straightforward, this method does come with trade-offs that are particularly relevant to GCC markets.
"The hold-out method is good to use when you have a very large dataset or you are building an initial model in your data science project." – Jaz Allibhai
Hold-out validation shines when working with large datasets, where a single split can still represent the overall data well. In GCC markets, where major retail chains across the emirates generate extensive transaction data, this method can deliver reliable early-stage insights without the need for computationally intensive iterations. However, since performance metrics can vary widely depending on how the data is split, this approach is better suited for initial testing rather than final model evaluation.
Limitations of Hold-Out Validation in GCC Markets
The main drawback of hold-out validation is its high variance. Results can change significantly depending on which data points are assigned to the training and testing sets. For instance, if the test set includes data from a Ramadan shopping surge or the Dubai Shopping Festival - events not represented in the training data - the evaluation may be skewed and unreliable. This variability makes it less ideal for final assessments in GCC markets.
Smaller datasets, which are common in niche UAE markets like luxury retail or localized property transactions in Dubai, present another challenge. Splitting limited data can leave too few samples in the training set, making it harder to capture complex patterns and increasing the risk of model bias. In such cases, techniques like K-Fold cross-validation, which make better use of the data, are often more effective.
Despite these limitations, hold-out validation remains a valuable tool for rapid prototyping during the early stages of GCC marketing campaigns. It helps quickly identify underperforming models before committing resources to fine-tuning. To ensure reliability, it’s crucial to maintain the temporal order of data and verify model coefficients for accuracy.
Comparison Table: Hold-Out Validation vs Full Dataset Usage
Here’s a quick comparison of hold-out validation and using the full dataset without splitting:
| Feature | Hold-Out Validation | Full Dataset Usage (No Split) |
|---|---|---|
| Method | Splits data into separate training and testing subsets. | Uses 100% of the data for both training and evaluation. |
| Advantages | Estimates performance on unseen data and helps mitigate overfitting. | Maximises data available for learning patterns. |
| Disadvantages | Results can vary significantly due to data split, leading to high variance. | Prone to overfitting, as the model may memorise the data. |
| Reliability | Useful for initial testing but not suitable for final evaluations. | Unreliable for assessing performance on new data. |
| GCC Example | Testing an e-commerce sales forecast for a UAE retailer using last month as the test set. | Building a real estate lead scoring model using all historical Dubai property data without a test phase. |
While hold-out validation provides a quick and practical way to evaluate models, its limitations - particularly in terms of data variability - highlight the need for more robust cross-validation techniques, which will be discussed next.
K-Fold Cross-Validation for Model Evaluation
K-Fold Cross-Validation tackles the limitations of hold-out validation by ensuring every data point is used for both training and testing. The dataset is divided into K equal-sized segments, and the model is trained K times. Each time, it uses K–1 folds for training and the remaining fold for validation. For instance, with 10 folds, the model is trained and tested 10 times, with each fold taking its turn as the test set.
The final performance score is calculated as the average across all iterations. This approach is particularly useful in GCC real estate analytics, such as predicting property prices or scoring leads. Instead of relying on a single train-test split, which might not fully capture model performance, K-Fold ensures every part of the dataset contributes to evaluation. This reduces the influence of data variability and provides a more dependable performance measure. As a result, it has become a cornerstone for accurate model evaluation in the GCC region.
"K-Fold Cross-Validation provides a more robust and reliable performance estimate because it reduces the impact of data variability." – DataCamp
In GCC property transactions, like those in Dubai or Abu Dhabi, where features such as location, property size, and proximity to landmarks like Burj Khalifa or Dubai Marina are key, K-Fold helps prevent overfitting, especially on high-value transactions. A common choice for K is 10, as it often balances low bias with modest variance in model estimates. With the GCC Digital Transformation Market projected to grow at a CAGR of 25.7% between 2024 and 2030, robust validation methods like K-Fold are becoming indispensable for marketing analytics.
Steps for K-Fold Implementation in GCC Analytics
To implement K-Fold for GCC datasets, follow these steps:
- Split the dataset into 10 equal folds.
- In the first iteration, use folds 2 through 10 for training and fold 1 for testing. In the next iteration, use folds 1 and 3 through 10 for training and fold 2 for testing. Continue until each fold has been used as the test set once.
For property price models, set shuffle=True to eliminate any inherent order in the dataset that might skew results. For example, if Dubai property data is sorted by neighbourhood or time, shuffling ensures each fold includes a diverse mix of properties. However, do not shuffle time-series data. When forecasting trends in GCC markets, use Time Series Cross-Validation to maintain the sequence of events and preserve temporal dependencies.
After training, calculate metrics such as Mean Absolute Error for price predictions or Accuracy for lead scoring across all 10 folds. The average of these scores reflects the model's overall performance and stability. For lead scoring models, this indicates how well the model generalises to unseen data. Remember to apply data scaling or normalisation within the cross-validation loop to avoid data leakage, which could lead to overly optimistic results.
Stratified K-Fold for Imbalanced GCC Marketing Data
In GCC markets, imbalanced datasets are a common challenge, especially in industries like retail and banking. For example, datasets might include retail leads with very low conversion rates or banking customers with minimal churn. Standard K-Fold cross-validation often struggles in these scenarios because random splits can create folds that completely miss minority class examples, leading to skewed and unreliable evaluations.
Stratified K-Fold addresses this issue by maintaining the original class proportions in every fold. For instance, if only 1% of customers churn while 99% are retained, each fold will reflect this ratio. This ensures that both the minority and majority classes are represented in every iteration, preventing models from appearing effective simply by predicting the dominant class.
"A 10-fold cross-validation... can easily break down in the case of class imbalances, even if the skew is less extreme than the one previously considered." – Imbalanced Learning: Foundations, Algorithms, and Applications
Although stratified folds require slightly more computational effort, they provide far more reliable evaluations. For GCC-specific use cases like churn prediction or lead conversion, it's better to prioritise metrics such as the F1-score or ROC AUC, which account for class imbalances, instead of relying on simple accuracy. Additionally, to ensure reproducibility and prevent data leakage, it's crucial to set a fixed random_state and include preprocessing steps within each fold.
Comparison Table: Stratified vs Standard K-Fold
| Feature | Standard K-Fold | Stratified K-Fold |
|---|---|---|
| Technique | Randomly shuffles and splits data into k groups. | Splits data while preserving class proportions across folds. |
| Balance Maintenance | Folds may lack minority class samples. | Each fold mirrors the original class distribution. |
| Computational Cost | Lower due to simpler splitting logic. | Slightly higher due to sorting and grouping. |
| GCC Industry Suitability | Suitable for balanced data tasks (e.g., inventory counts). | Perfect for imbalanced data tasks (e.g., banking churn). |
| Risk | Can lead to misleadingly high accuracy on imbalanced data. | Provides more dependable performance estimates for all classes. |
sbb-itb-058f46d
Time Series Cross-Validation for GCC Market Forecasting
Time series cross-validation offers a tailored approach to tackle the temporal dependencies often seen in GCC market data. Whether you're forecasting retail sales or real estate prices in the region, maintaining the chronological order of data is crucial. Unlike datasets with independent observations, time series data is influenced by autocorrelation, trends, and seasonality. Standard K-Fold cross-validation, which disregards data order, can inadvertently expose future data during training, leading to overly optimistic predictions.
To address this, forward-chaining is used to preserve the temporal sequence. This method divides data into consecutive blocks, ensuring the training set always precedes the validation set. For example, when predicting Dubai's real estate prices for Q1 2026, you would train your model using data from 2024–2025 and validate it on Q1 2026. This approach mirrors real-world forecasting scenarios, where only past data is available for making predictions.
"Keeping the order of observations is key for obtaining reliable estimates. Arguably, it's the golden rule for applying cross-validation with time series." – Vitor Cerqueira, Artificial Intelligence Researcher
For GCC markets, selecting between rolling windows and expanding windows depends on the volatility of the industry you're analysing. Rolling windows use a fixed-size training set that shifts forward, making them suitable for sectors like retail, where conditions change rapidly. On the other hand, expanding windows grow the training set with each iteration, incorporating all historical data. This approach reduces variance and works well for real estate markets, where long-term trends often carry more weight.
To further refine your cross-validation process, consider advanced techniques that minimise data leakage. For instance, when working with correlated daily sales data, introducing a purging gap between training and validation sets helps reduce optimistic bias by increasing independence. Similarly, if your analysis involves multiple product lines or store locations across the GCC, applying GroupTimeSeriesSplit ensures that each time series remains confined to its specific fold, preventing information leakage between related groups.
Lastly, always examine your model's residuals for serial correlation. Ensuring that the errors are uncorrelated is a key step in validating the reliability of your cross-validation results.
How Wick's Four Pillar Framework Supports Model Optimization
Wick's Four Pillar Framework enhances marketing analytics across the GCC region by focusing on two essential pillars: Capture & Store and Tailor & Automate. Tailored for industries like retail and real estate, this framework addresses the unique data challenges specific to the GCC, ensuring seamless integration into regional analytics workflows.
The Capture & Store pillar tackles the complexities of data collection in the GCC, where the UAE's diverse population - 88% of which consists of expatriates - requires careful stratification of data. This diversity demands that models accurately reflect the behaviours and preferences of various nationalities rather than focusing solely on dominant groups. The "Store" aspect ensures traceability by logging critical metadata, such as random seeds, data splits, and performance metrics. Tools like MLflow and DVC support this process, allowing teams to reproduce results and monitor how models evolve over time.
Building on the foundation of data collection, the Tailor & Automate pillar focuses on refining model performance while maintaining stability and avoiding data leakage, particularly in personalised marketing efforts. Wick achieves this through nested cross-validation, aligning with UAE-specific quantitative validation standards. This method uses an inner loop for hyperparameter tuning and an outer loop for error estimation, effectively eliminating selection bias in personalised models. Automated pipelines further strengthen this process by limiting preprocessing tasks (like scaling and encoding) to training folds only, ensuring consistent and reliable evaluation metrics that adhere to UAE standards.
This approach proves especially valuable in managing seasonal fluctuations. For instance, Dubai hosted a record-breaking 18.72 million international visitors in 2024, creating significant demand spikes in retail and real estate. To address such variability, time-series-aware cross-validation methods are employed, ensuring that predictive models remain robust and effective in fluctuating conditions. By aligning with proven cross-validation techniques, Wick's framework underscores the importance of reliable, GCC-specific model validation.
Conclusion
Cross-validation techniques play a crucial role in creating reliable marketing models, especially in the GCC's fast-changing retail and real estate sectors. For example, K-Fold cross-validation provides consistent performance estimates by repeatedly resampling data, while Stratified K-Fold is particularly useful for managing imbalanced datasets. This makes it ideal for scenarios like predicting high-value property conversions or luxury retail transactions, as it maintains class proportions across each fold. On the other hand, Time Series cross-validation is essential for forecasting trends in volatile markets, ensuring models don’t inadvertently use future data when predicting seasonal retail changes or property trends.
The UAE's distinct market dynamics require validation techniques tailored to its unique characteristics. For instance, GroupKFold is highly effective for geographically clustered data - like samples from Dubai or Riyadh - ensuring that all data from a specific region stays within a single fold. This approach prevents data leakage and supports regional generalisation.
These technical methods align closely with broader data processing strategies. For example, fitting scalers and encoders only on training folds helps avoid information leakage. Additionally, nested cross-validation is invaluable for hyperparameter optimisation, using an inner loop for tuning and an outer loop for evaluating error. Research suggests that using 5 or 10 folds strikes a good balance between bias and variance.
Such careful validation practices are a cornerstone of Wick's Four Pillar Framework, which ensures that model optimisation is both rigorous and regionally informed. By combining these advanced techniques with Wick's expertise in data analytics and AI-driven personalisation, businesses across the GCC can seamlessly integrate cross-validation into their marketing workflows. This blend of precision and local insight empowers companies to deploy predictive models that drive meaningful and sustainable growth.
FAQs
What is the most effective cross-validation technique for handling imbalanced datasets in GCC industries?
For industries in the GCC, such as retail and real estate, where imbalanced datasets are common, Repeated K-fold cross-validation proves to be an excellent evaluation method. It works by repeatedly dividing the data into training and testing sets, which helps account for uneven class distributions. This approach provides a more consistent and reliable estimate of model performance.
This method is especially relevant in GCC markets, where datasets often reflect distinct patterns shaped by regional consumer behaviours and industry trends. Using Repeated K-fold cross-validation, businesses can create predictive models that not only deliver accurate results but also align with the unique demands of the region.
How does time series cross-validation help prevent data leakage in GCC market forecasting?
Time series cross-validation is a method that ensures models are trained exclusively on past data relative to each test point. This approach prevents any future market information from impacting predictions during validation, which is crucial for maintaining accuracy.
This technique proves especially useful in GCC sectors such as retail and real estate, where precision in forecasting depends heavily on preserving the integrity of time-based data. By strictly organising training and testing datasets along a timeline, it eliminates data leakage, resulting in insights that are both dependable and practical for analysing market trends and making informed decisions.
Why is K-Fold cross-validation commonly used in GCC real estate analytics?
K-Fold cross-validation plays a crucial role in GCC real estate analytics, offering a dependable way to evaluate model performance. By splitting the dataset into several subsets, known as "folds", this method ensures that models are trained and tested on different segments of the data. This process minimises bias and maximises the utility of datasets, which are often limited or prone to noise in the real estate market.
This technique is especially beneficial in the GCC real estate industry, where market conditions are constantly shifting, and data inconsistencies are common. K-Fold cross-validation reduces the risk of overfitting, enabling predictive models to perform more reliably and adapt to the fast-changing dynamics of the sector.